
They
are:
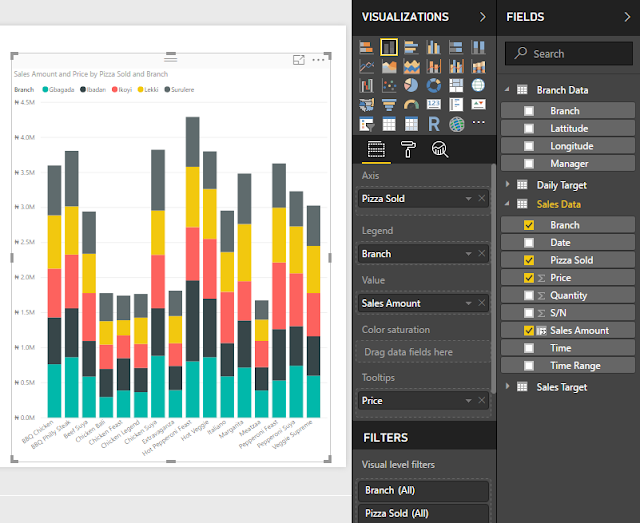
1. Stacked Bar Chart: This allows you to create a bar chart
with the breakdowns (field in legend) stacked on top of each other. It can be
used to show total sales with breakdown by products or region. It has five
components — Axis (where you put the field that should have separate bars, like
date), Legend (where you put the field to stack one on another for each
category in the axis, e.g. products or regions; anything you drag into Legend
comes out with different colors), Value (where you put the field with the
figures you want to plot), Color Saturation (allows you to represent the values
in a field on a light to dark color intensity on the plotted value bars. You
can’t use it and Legend together. A likely use will be to show volume/quantity
of products sold while the bar values present the sales amount), and Tooltips
(allows you to show extra details, like price per unit of the product).

2. Stacked Column Chart: Technically same as the Stacked Bar
Chart just the orientation is different, its bars are vertical.
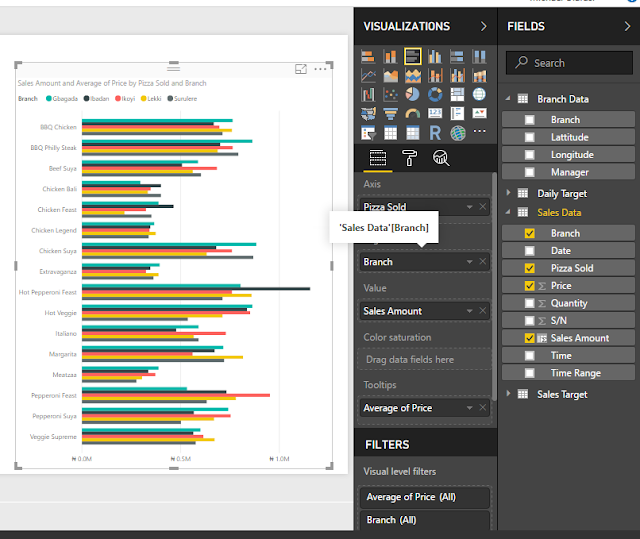
3. Clustered Bar Chart: The difference between this and the
stacked one is that it has the breakdowns (legend values) plotted on
independent bars rather than stacked one on another.
4. Clustered Column Chart: The difference between this and the
stacked column chart is that it has the breakdowns (legend values) plotted on
independent bars rather than stacked one on another.

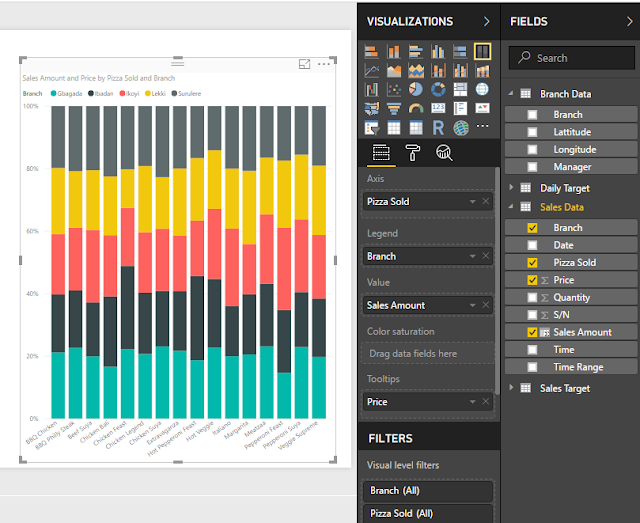
5. 100% Stacked Bar Chart: This has the legend values (breakdown)
expressed as percentages of the total value per axis item. Useful for showing
relative contribution of sales by the different branches to total sales each
day/month. And if you work with market research data, excellent for market
share representation.

6. 100% Stacked Column Chart: Just as you would have guessed, it is
the column version of the 100% Stacked Bar Chart.
7. Line Chart: Has all the components of the Bar/Column chart except the
Color Saturation one. The line chart is to show trend (change over time), so
you should always put a date or time field in the Axis.

8. Area Chart: It is very much like the line chart but with the area under
the lines shaded. Has same components as the line chart.

9. Stacked Area Chart: You already know area chart, this is
when you stack the legend entries one on another.

10.
Line and Stacked Column
Chart:
This is just combining line chart with column chart in the same visual. It is
what we call Combo Chart in Excel and can be useful for showing two distinct
insights in one visual — like the gross margin as a line chart and the revenue
as a column chart over a period of time.

11.
Line and Clustered Column
Chart:
Again, just like the line and stacked column one except that the columns aren’t
stacked.

12.
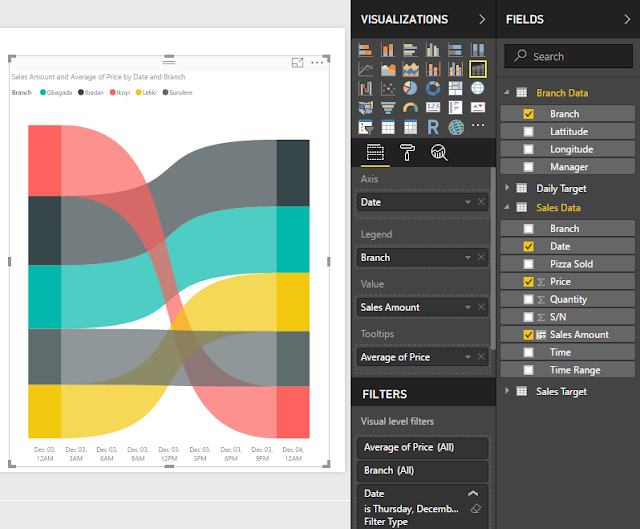
Ribbon Chart: This chart is a lot like
the area chart but with the added advantage that it makes it easier to see the
changes in the values of the entries in the legend.
13.
Waterfall Chart: This chart is for showing
the movement in a metric over a period of time, emphasizing the initial value
and the end value. It is a beloved chart of finance analysts, it is often used
to present changes in a company’s cashflow from opening cashflow to closing
cashflow over a reporting financial period.

14.
Scatter Chart: This chart is for showing
the relationship between two variables. That is why it requires you put a field
in X-axis and another in Y-axis. And it can also serve as bubble chart, you
only need to drag the field to determine the bubble size into Size.

15.
Pie Chart: This chart shows relative
contribution of entries in the field put in the Legend to the field put in the
Values. You can also put a field with additional useful information in the
Details.

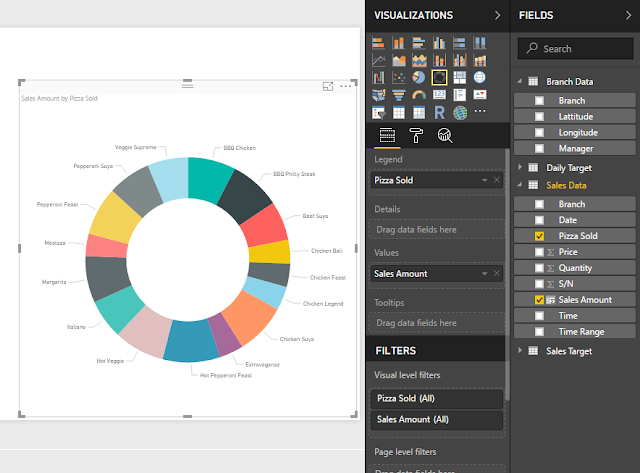
16.
Donut Chart: It is exactly pie chart
but with the traditional donut hole.
17.
Treemap: This chart shows relative
contribution but unlike pie chart that fits everything in a big circle this one
fits everything in a resizable rectangle.

18.
Map: The name is very self-explanatory.
Normally, you would drag countries/cities or any location field to Location but
if the locations are not very popular places you might need to get the GPS
coordinates and place in the Latitude and Longitude.

19.
Filled Map: It is like the Map but
fills the entire location area on the map taking the shape of the
country/state/city.

20.
Funnel: This chart is best for
stage-like fields and values. Popular for sales conversion records. You can put
the sales/conversion stages in the Group.

21.
Gauge: This chart is great for
showing the values against target on a gauge-like scale. And you can set the
dimensions (minimum and maximum of the scale).
It is one of the few visuals that allow you to set an alert on in the
published Power BI dashboard

22.
Card: It displays just one
thing. Can be very useful for showing total sales, KPI figure and counts (like
number of stores or orders). It is also one of the visuals that allow you to
set an alert on it in the published Power BI dashboard.

23.
Multi-row Card: It is like card with
extra features — ability to display values of more than one field. An example
is sales by branch.

24.
KPI: It shows the variance between a value and its set target.
Very useful for key performance indicators (KPIs).

25.
Slicers: I often call them nicer
filters. Work exactly as a filter.

26.
Table: It is an intuitive table
that aggregates the fields you put in intelligently.

27.
Matrix: It is exact replica of
PivotTable. We have already used it in the last sample project.

28.
R Script Visual: This allows you to run R
scripts in Power BI. Might be of particular interest to people already
proficient in data analysis using R.

29.
ArcGIS Maps for Power BI: This is very much like
Map but with some peculiar features you might find very useful.


Lastly,
Power BI allows you to access more visuals to use in your reports via Custom
Visuals on the Home menu.


0 comments:
Post a Comment
You can be sure of a response, a very relevant one too!
Click on Subscribe by Email just down below the comment box so you'll be notified of my response.
Thanks!