Old habits die hard. One of my 2018 new year resolutions is to reduce talking about myself online. I have talked too much about every tiny bit of my life the past four years that I want to try not talking anymore and put more effort into doing. That is why you have stopped receiving daily blog posts from me. 

Then again, old habits die hard.

Since the last time I talked about myself -- getting into IoD (Institute of Directors), trouble with VIO (my car finally passed on 3rd retry) and French adventures -- a lot has happened in my life.

1. I lost my phone (pickpocket guy) and bought the most amazing phone I have ever had. An LG G4 with camera module. It's camera is WOW. Got it at a crazy deep discount (approx. 60% discount) at SLOT.


See a picture I took with it

Where I stayed In South Africa
2. Executed Power BI consulting project in Ghana and South Africa (same client). Not sure I have cool pictures from the Ghana one. The host company folks were very nice and took me to very nice places in Ghana and South Africa. I went to the tallest building in Ghana where one of the company staff lives, Villagio and the bar on the roof (Skybar). Ate at amazing Chinese restaurant (Imperial Peking Chinese Restaurant).
Tried out the local Ghanaian dishes

The view from on top Skybar (the cars and all look like Christmas light)
In South Africa, I went to the popular Mandela Square. Ate at Butcher's Shop, The Baron and Hard Rock cafe.

Took advantage of my IoD benefits to use SDS lounge at MMA (paid a ridiculously low amount due to deep discount for IoD members)

The Game of the Day (animal in the pics) I ate at Butcher's Shop
Nelson Mandela Square

Me, in jeans 😀

On the very street I stayed
3. We now Have Two Full-Time Staff. They are simply the best! And business is getting better and better. Thinking of adding a third full-time staff. I still have other non full-time team members. In fact, the two full-time staff used to be non full-time team members. Our business monthly overhead/expenses is now over N500,000. I am now learning to not just lead a team but build a proper company. Thanking everyone of you who has morally and technically supported me thus far.

4. My Power BI book is on fire on Amazon. Sales are like I have never experienced for all my prior books combined. Almost, everyday I am generating sales across the e-book and more expensive print version.


You can grab your copy at https://www.amazon.com/dp/B078NF5XYP 

5. I got a new Microsoft Certification this month. Microsoft Certified Professional (MCP). Did the qualifying exam last year but result just came out a few days ago. I am now on course (just one remaining exam away from MCSA BI Reporting certification).


Done with the 70-779 exam, 70-778 is left to earning the MCSA BI reporting certification


Now you can get iTunes Cards extremely easily and pay in Naira from www.usitunescard.com The cards are valid for US iTunes account only.

And here is a personal story that led to this.

It all started in 2013 (or so) when I needed to buy a movie on iTunes and it was no small trouble. Many contents aren't available for the Nigerian iTunes account. The changing your country to US makes those contents available but then you have to pay with a US debit card (one with a US billing address). After hours and days of troubles, I ended up buying a US iTunes gift card and loading on my US iTunes account.


Soon, I started buying more gift cards. And then I noticed that there would be people like me needing such cards too. So I did a market entry test. And was amazed by how much demand there is for US iTunes cards, even had a few people contact me from outside the country (India, Pakistan etc). Seems the problem isn't just here in Naija.

So I have now built www.usitunescard.com to solve that problem easily for all Nigerians.

I sell the cards at almost the same amount it costs to get them directly from Apple (actual face value). Added the Paystack transaction charge and accommodation for exchange rate fluctuation but it still comes at less than N400/$ to the buyer/customer. While others on Konga and other e-stores are selling as high as a rate of N600/$ and more.


$5 iTunes card sells for N1,999
$10 iTunes card sells for N3,999
$15 iTunes card sells for N5,999
$25 iTunes card sells for N10,999
$50 iTunes card sells for N19,999
$100 iTunes card sells for N39,999

It is the cheapest I have seen anyone sell iTunes Cards here in Nigeria. Below are screenshots of how much the same cards are sold for on Konga


Again, the store link is www.usitunescard.com 

Guaranteed low prices and instant delivery always!

 Power BI visuals are the actual elements — tables, charts, filters/slicers, maps, etc — that present the data in your report. By default, Power BI comes with 29 visuals.


They are:

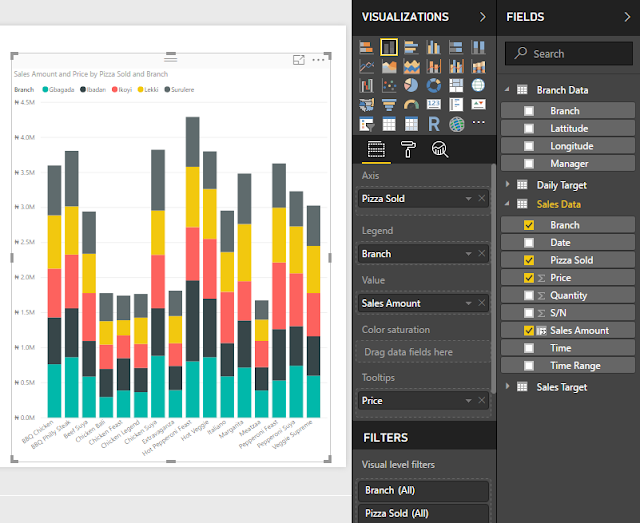
1. Stacked Bar Chart: This allows you to create a bar chart with the breakdowns (field in legend) stacked on top of each other. It can be used to show total sales with breakdown by products or region. It has five components — Axis (where you put the field that should have separate bars, like date), Legend (where you put the field to stack one on another for each category in the axis, e.g. products or regions; anything you drag into Legend comes out with different colors), Value (where you put the field with the figures you want to plot), Color Saturation (allows you to represent the values in a field on a light to dark color intensity on the plotted value bars. You can’t use it and Legend together. A likely use will be to show volume/quantity of products sold while the bar values present the sales amount), and Tooltips (allows you to show extra details, like price per unit of the product).


2. Stacked Column Chart: Technically same as the Stacked Bar Chart just the orientation is different, its bars are vertical.


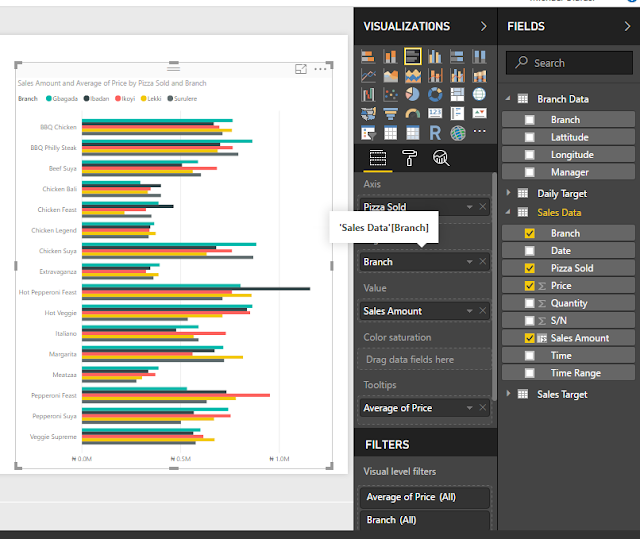
3. Clustered Bar Chart: The difference between this and the stacked one is that it has the breakdowns (legend values) plotted on independent bars rather than stacked one on another.


4. Clustered Column Chart: The difference between this and the stacked column chart is that it has the breakdowns (legend values) plotted on independent bars rather than stacked one on another.


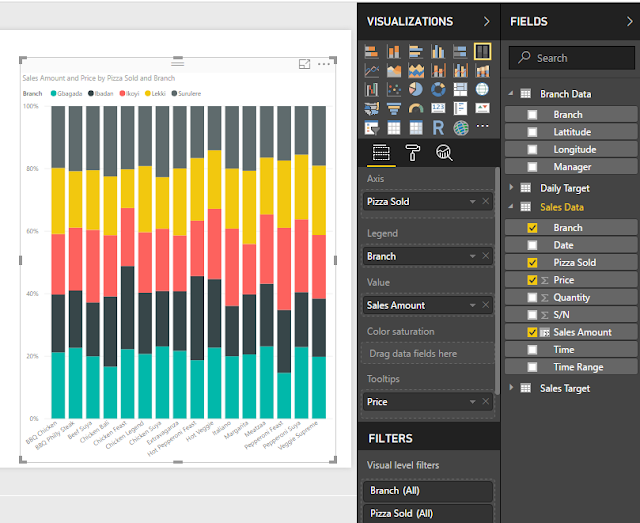
5. 100% Stacked Bar Chart: This has the legend values (breakdown) expressed as percentages of the total value per axis item. Useful for showing relative contribution of sales by the different branches to total sales each day/month. And if you work with market research data, excellent for market share representation.


6. 100% Stacked Column Chart: Just as you would have guessed, it is the column version of the 100% Stacked Bar Chart.


7. Line Chart: Has all the components of the Bar/Column chart except the Color Saturation one. The line chart is to show trend (change over time), so you should always put a date or time field in the Axis.


8. Area Chart: It is very much like the line chart but with the area under the lines shaded. Has same components as the line chart.


9. Stacked Area Chart: You already know area chart, this is when you stack the legend entries one on another.


10.        Line and Stacked Column Chart: This is just combining line chart with column chart in the same visual. It is what we call Combo Chart in Excel and can be useful for showing two distinct insights in one visual — like the gross margin as a line chart and the revenue as a column chart over a period of time.


11.        Line and Clustered Column Chart: Again, just like the line and stacked column one except that the columns aren’t stacked.


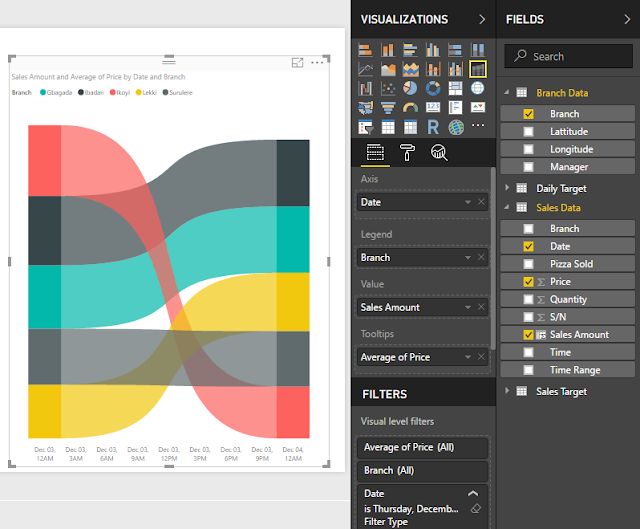
12.        Ribbon Chart: This chart is a lot like the area chart but with the added advantage that it makes it easier to see the changes in the values of the entries in the legend.


13.        Waterfall Chart: This chart is for showing the movement in a metric over a period of time, emphasizing the initial value and the end value. It is a beloved chart of finance analysts, it is often used to present changes in a company’s cashflow from opening cashflow to closing cashflow over a reporting financial period.


14.        Scatter Chart: This chart is for showing the relationship between two variables. That is why it requires you put a field in X-axis and another in Y-axis. And it can also serve as bubble chart, you only need to drag the field to determine the bubble size into Size.


15.        Pie Chart: This chart shows relative contribution of entries in the field put in the Legend to the field put in the Values. You can also put a field with additional useful information in the Details.


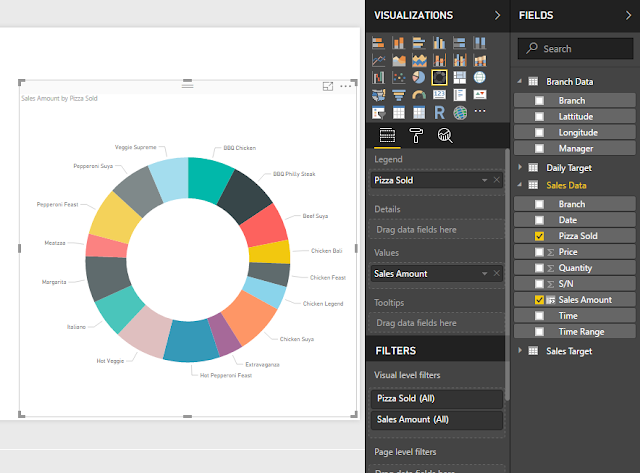
16.        Donut Chart: It is exactly pie chart but with the traditional donut hole.


17.        Treemap: This chart shows relative contribution but unlike pie chart that fits everything in a big circle this one fits everything in a resizable rectangle.


18.        Map: The name is very self-explanatory. Normally, you would drag countries/cities or any location field to Location but if the locations are not very popular places you might need to get the GPS coordinates and place in the Latitude and Longitude.


19.        Filled Map: It is like the Map but fills the entire location area on the map taking the shape of the country/state/city.


20.        Funnel: This chart is best for stage-like fields and values. Popular for sales conversion records. You can put the sales/conversion stages in the Group.


21.        Gauge: This chart is great for showing the values against target on a gauge-like scale. And you can set the dimensions (minimum and maximum of the scale).  It is one of the few visuals that allow you to set an alert on in the published Power BI dashboard


22.        Card: It displays just one thing. Can be very useful for showing total sales, KPI figure and counts (like number of stores or orders). It is also one of the visuals that allow you to set an alert on it in the published Power BI dashboard.


23.        Multi-row Card: It is like card with extra features — ability to display values of more than one field. An example is sales by branch.


24.        KPI: It shows the variance between a value and its set target. Very useful for key performance indicators (KPIs).


25.        Slicers: I often call them nicer filters. Work exactly as a filter.


26.        Table: It is an intuitive table that aggregates the fields you put in intelligently.


27.        Matrix: It is exact replica of PivotTable. We have already used it in the last sample project.


28.        R Script Visual: This allows you to run R scripts in Power BI. Might be of particular interest to people already proficient in data analysis using R.


29.        ArcGIS Maps for Power BI: This is very much like Map but with some peculiar features you might find very useful.


Lastly, Power BI allows you to access more visuals to use in your reports via Custom Visuals on the Home menu.


Today's guest post is from one of the big men I have in my network. He is the CEO of a big company, one so big that one of my big bosses in Siemens left Siemens for it, and a multinational firm in the top 4 positions in its industry globally. I have been doubly fortunate to have had my company do a training for them, and, later, to be known by the CEO. 

He's very passionate about personal/family finance and investment education. He makes time out of his busy schedule and spends his own money to freely share his passion and knowledge. When he first reached out to me last year, he was asking if he could pay me to help build an app that will help all Nigerians better manage their money. And he easily overlooked my horrible phone calls picking and email reply habit. He treated me like an equal. He knows well the really rich people (mega wealthy) and can better describe them than most of us. So enjoy with an open mind his insights into how to go through these economic hard times like the mega wealthy do.
image: haikudeck.com

The fact that Nigeria is going through a period fraught with economic challenges and loads of uncertainty cannot be swept or wished away. However not everyone is under the impression that there’s no light at the end of the tunnel. This period is a phase Nigerians are passing through and no one knows this better than the wealthy.

While many have given into despair the rich continue to make bold moves and expect to succeed. While the poor see ‘doom and gloom,’ the rich see ‘boom and bloom’ no matter the harsh economic realities. 

I discovered ten reasons why the rich continue to thrive:

The rich do not complain about the harsh economic situation
Seriously, times like this do not call for whining, moaning and complaining. Just take a look at the social media, its complaints galore. Things may be tough and difficult, but complaining isn’t going to make it any better. Those who complain are likely not to see opportunities when they arise, because their vision is impaired by the negatives. Truth be told I am yet to see any of Nigeria’s mega wealthy complaining loudly that things are not working. So quit complaining and whining.

Positive Mental Attitude
Things may go bad, from bad to even worse, but the rich believe that they’ll get better. In terms of beliefs and attitudes they are light years apart from the poor because in these times they are upbeat and positive that an economic turnaround is just across the corner. Aliko Dangote, Africa’s richest man continues to promote Nigeria as a worthy investment destination, notwithstanding. There must be something he is seeing that most cannot see, which is a product of his attitude

They don’t fear failure or losses
No rich person got to be rich without having failed several times and losing substantial sums of money. In fact the rich know that failure is good for further growth and success, because its lessons are invaluable. They have a lot of experience handling failure that they have conquered the fear of it. They have a strong belief that they will gain it back again while the poor are so scared of failing.

Opportunities to build wealth remain
It might surprise many people to know that some people are still going to make wealth during this period. Not all opportunities are completely dried up, in fact several new ones have replaced them that will make wealth for the discerning.

There is no better time than now to expand
The rich know that in times like this when things are hard they might need to expand to take advantage of emerging opportunities as tough times won’t last forever. Expansion is necessary in order to take advantage of opportunities so as to be perfectly positioned when the economic situation improves.

They possess a clear understanding of times and seasons
Life is measured in times and seasons and no one understands this fact than the rich. Nigeria may be in a season of want and lack but after this season comes one of plenty and abundance. Just as the day follows night, abundance is sure to follow after times of lack and hardship.

Money in the bank is no longer a motivating factor, creating value is
There comes a stage in the life of the wealthy where the number of zeros in your bank balance becomes insignificant, rather the value that you create becomes paramount. The rich love contending against opposing forces such as the harsh economic situation to still achieve economic success for they know it’s possible. Money in the bank is important, however according to Donald Trump, “Money is just a means of keeping score,” and he does deals “just to do it.”

Diversified investment portfolios
The rich diversify their investment portfolio in order to earn income from multiple sources. Even in a challenging economic situation some investment vehicles will appreciate in value while others will depreciate. This helps to keep many of them in liquidity in the harshest of economic climes.

A healthy belief in themselves and their abilities
What would you do if you knew you couldn’t fail? Would you attempt grander projects or avoid taking risks? The rich believe that anything they touch will literally turn to gold. They don’t allow limitations or challenges to hold them back from believing that all things will turn out for their good in the end.

Giving mentality
Givers never lack. The economic situation has brought hardship on many Nigerians, and this is the time people need help more than ever before. The rich continue to give towards worthy causes and help the less privileged thus making them perfectly positioned to continue to receive more. It is a fact of life that the more you give the more you receive.


My position on the economy is that things are on the road to recovery and even though there are pains we will see the gains in the not too distant future. Everybody may be affected in one way or the other by the situation but not all are adversely affected.
I want you to know that it’s possible that this could be your season for financial success even though times are hard. You too can thrive while others are struggling to survive. All it takes is to do what the rich are doing and you are certain to get the same results the rich are getting.


PROFILE
Kenneth Doghudje is intensely committed to seeing people achieve their financial goals and aspirations in Africa. A CEO by day and a blogger by night, he believes that the secret to anyone succeeding financially is to mix workable insights with action which translates to wealth and riches.
Please endeavor to visit www.moneytalkNG.com for more articles on money and personal finance. You can also follow Kenneth on social media:
@moneytalkNG on twitter ,

moneytalkNG on facebook & Instagram